With winter steadily closing in it was time to resume my room heating setup from summer hibernation. My plants seemed to dislike the new conditions even after a few days of acclimatization so I had to debug things.
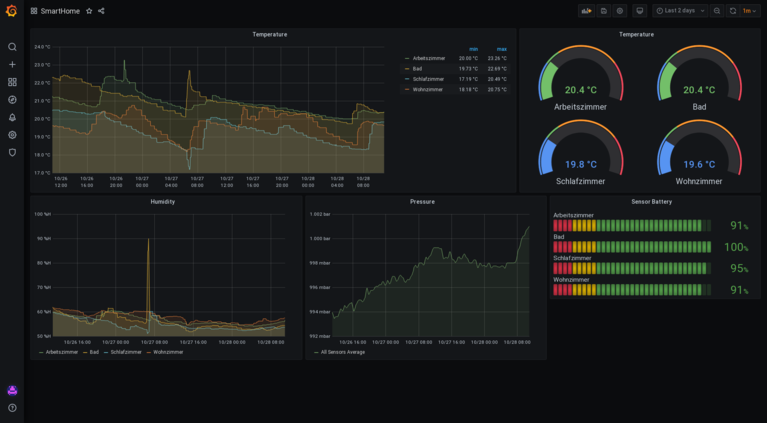
How do you validate a smart heating control setup, nerd-style? By deploying a bunch of ZigBee sensors and making them part of your Grafana infrastructure dashboard!
Hardware
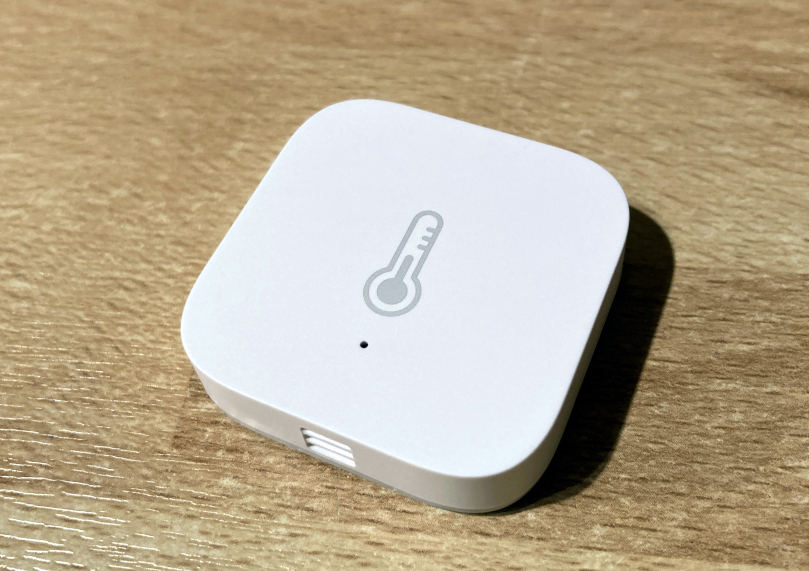
My choice for sensors fell on the (relatively cheap) Aqara Temperature and Humidity Sensor that can measure temperature, humidity and pressure and should run long enough on one battery for me not to care.
As a base station for the sensors to talk to I first considered buying a proper ZigBee gateway (e.g. an Aquara Hub) but looking at the price tag I took a step back from this option.
These gateways all come down to basically two logical parts: a radio interface and an embedded system that provides a network interface for (cloud) integration. Having my NAS running 24/7 there was no need for the latter anyway so I started looking for ZigBee interfaces.
Soon I discovered the ConnBee II Universal ZigBee Gateway by Dresden Elektronik. Being advertised as works without cloud it comes in form of a USB module as radio interface. On top of that Dresden Elektronik provides the Phoscon HTML5 app as a webinterface as well as the deCONZ application that features a Hue compatible REST API for easy network integration.
deCONZ is available on GitHub under BSD 3-Clause License and seems to have a very active community - thanks, Dresden Elektronik!
Running deCONZ
deCONZ is available on Linux for x86_64 as well as ARMv7 and ARM64. There are pre-built images for Raspberry Pi and on top of that there is a Docker Image.
A downside of the design of deCONZ is that it ships as a single binary with lots of Qt dependencies. This means that you cannot run it on a headless server (i.e. my NAS) without pulling in lots of X11/Wayland packages. Apparently this issue is already being worked on but for now I went for containerization as a solution to the dependency problem.
Having always preferred LXC over Docker I spent quite some time trying to get it running with that. After all they both use the same in-Kernel isolation mechanisms so why should it make a difference? Well, I have to admin that in the end it didn't work out and I did not want to put more time into finding out why, so after running a test installation on a Pi3 I took this as an opportunity to get my feet wet with Docker.
Here's what I used as docker-compose.yml (mostly identical to
marthoc/docker-deconz):
version: "2"
services:
  deconz:
    image: marthoc/deconz
    container_name: deconz
    network_mode: host
    restart: always
    volumes:
      - /opt/deconz:/root/.local/share/dresden-elektronik/deCONZ
    devices:
      - /dev/ttyACM0
    environment:
      - DECONZ_DEVICE=/dev/ttyACM0
      - DECONZ_WEB_PORT=8080
      - DECONZ_WS_PORT=8443
      - TZ=Europe/Berlin
host networking is used in order to enable the Phoscon app to discover deCONZ
via UPnP. My NAS has other services running on TCP/80 and TCP/443 so I'm
selecting different ports via DECONZ_WEB_PORT and DECONZ_WS_PORT.
Prometheus Integration
With the deCONZ REST API running there's plenty of paths to go down for finally having nice Grafana temperature widgets, including FHEM and OpenHAB. This all seemed like yet another black hole for spare time investment so I tried to find something more KISS-style.
With Prometheus already running for infrastructure monitoring I found the perfect match in form of deconz-exporter. Unfortunately the project is not in the best shape and I had not written a single line of Go before. Eventually I got it running but I'm hesitating to share my sketchy hacks. I will submit a pull request as soon as I got them streamlined a bit.
Acquiring an API token for deCONZ can be done easily using curl:
$ curl -X POST -H 'Content-Type: application/json' \
    -d '{"devicetype":"deconz-exporter"}' http://localhost:8080/api

[{"success":{"username":"7B41C70A71"}}]
The exporter can then be run via systemd:
# /etc/systemd/system/deconz-exporter.service
[Unit]
Description=deCONZ Exporter
Before=prometheus.service

[Service]
ExecStart=/usr/local/bin/deconz-exporter
User=node_exporter
Environment=DECONZ_HOST=127.0.0.1
Environment=DECONZ_PORT=8080
Environment=DECONZ_TOKEN=7B41C70A71
Restart=always
RestartSec=30

[Install]
WantedBy=multi-user.target

